How to Interpret GWAS Data: Application in Agriculture
Uncover how to interpret GWAS data in agriculture! Learn about its main data interpretation types, key points, and applications. Dive in to explore limitation and future prospects. Start exploring now to enhance the understanding of GWAS in agriculture.
 kikogarcia
In the field of genetic research, genome-wide association studies (GWAS) have become a powerful tool to explore the genetic basis of complex traits and diseases. By scanning the whole genome of a large number of individuals, GWAS can detect genetic variation sites significantly associated with specific phenotypes. Understanding the results of GWAS deeply can reveal the biological mystery and potential significance behind this genetic information.
Main Types of GWAS Data Interpretation
GWAS results are generally presented in various forms. On the one hand, the intensity of association between each point on the chromosome and the trait will be displayed intuitively through Ma's Manhattan map, and the peak value will highlight the significant sites. On the other hand, the QQ chart is used to compare the observed value with the expected value to evaluate the reliability of the results. It will also list the associated site information, effect value, and so on in detail in the form of a table, which is convenient for in-depth analysis.
Manhattan plot: This is one of the most common visualization methods of GWAS results. The abscissa indicates the chromosome position, and the chromosomes of the whole genome are arranged in turn. The ordinate represents the negative logarithm (usually based on 10) of the P value obtained by correlation analysis. The smaller the P value, the greater the negative logarithm and the higher the position of the point in the diagram. Each point in the graph represents a single nucleotide polymorphism (SNP) site. By observing the distribution of points, we can intuitively see which chromosome regions have SNP sites significantly related to traits. Generally, there will be one or more horizontal lines indicating the threshold of statistical significance, and the SNP corresponding to the point exceeding this threshold is considered to be significantly related to the studied traits.
QQ Plot: It is mainly used to evaluate whether the distribution of P values in the results of correlation analysis conforms to the expected theoretical distribution. The abscissa is the quantile of the theoretical P value calculated according to the expected uniform distribution, and the ordinate is the quantile of the actually observed P value. If there is no systematic deviation in the GWAS results, the points in the graph should be roughly distributed in a straight line. If the tail deviates from the straight line, it may suggest that there are some loci that are really related to the trait, or there are false positive results caused by population stratification and other problems.
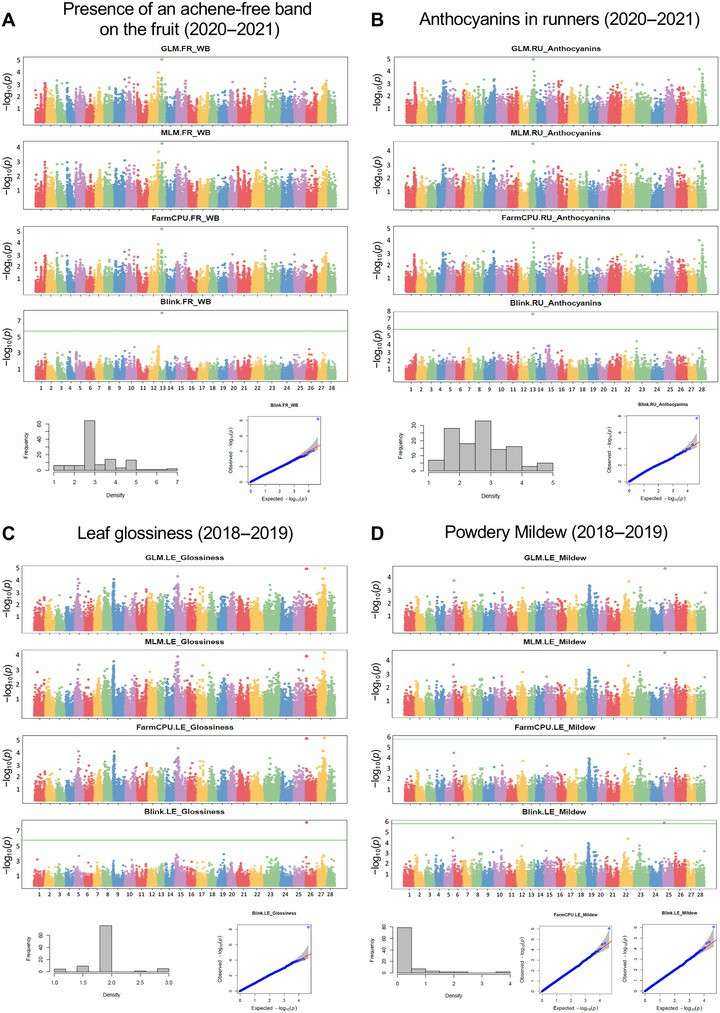
Significant GWAS associations for the presence of an achene-free band on the fruit (Muñoz et al., 2024)
Regional association plot: Aiming at a specific chromosome region, it shows the degree of association between SNP loci and traits in this region. Usually, the gene structure, linkage disequilibrium (LD) pattern of SNP, and the distribution of P value associated with traits in this region are displayed. It can help researchers to observe in detail which SNPs are most closely related to traits in the region of interest and the relationship between these SNPs and nearby genes, which is helpful to further explore potential functional genes.
Enrichment analysis results: The gene functions, pathways, or biological processes enriched by significant SNPs found by GWAS are analyzed, and the results are usually presented in the form of tables or histograms. The table will list the significantly enriched gene ontology (GO) terms, Kyoto gene and Genomes (KEGG) pathways, and other information, as well as the corresponding enrichment multiple, P value, and other statistical indicators. A histogram can visually compare the enrichment degree of different functional categories or pathways, and help researchers understand the biological mechanism in which SNPs related to traits may participate.

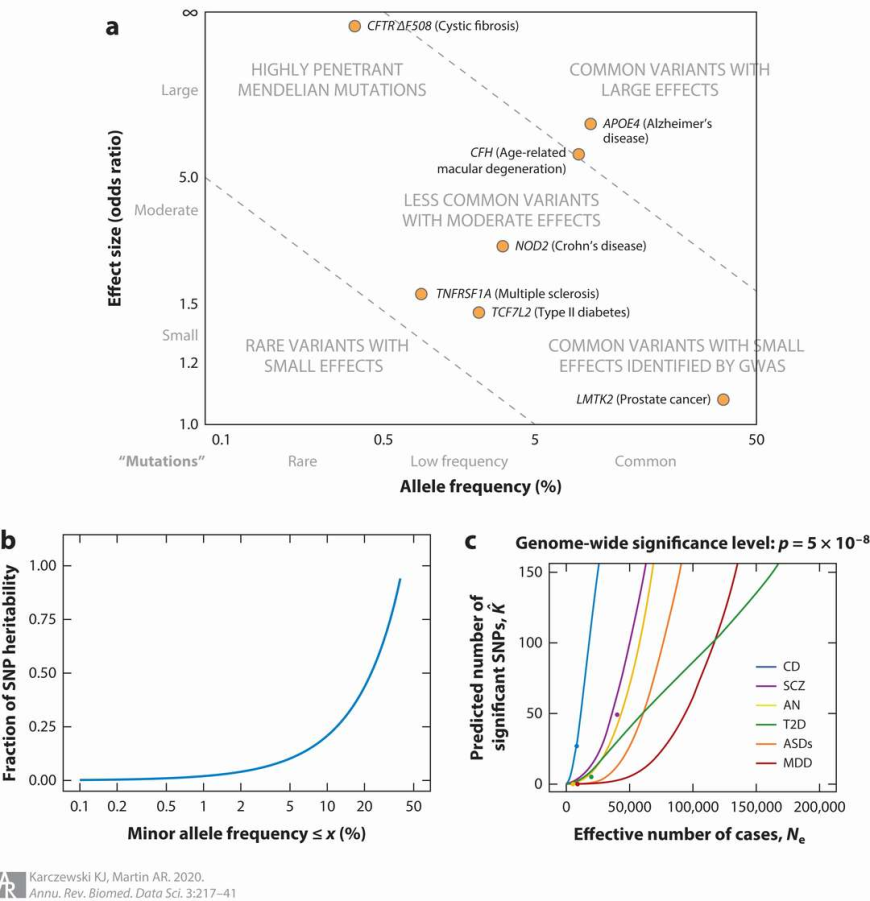
Power in GWAS is informed by allele frequency, effect size, and sample size (Karczewski et al., 2020)
Key Points in GWAS Data Interpretation
GWAS, as a powerful means to carry out association analysis on common diseases or traits in the whole genome, aims to accurately mine genetic variation closely related to diseases or traits. When interpreting the results of GWAS, we should pay attention to the significance of mutation sites, the size of effects, the differences among different populations, and combine biological functions and related pathways.
SNP Location and Gene Annotation
Intra-gene and inter-gene: If the significant SNP is located in the gene, especially in the coding region, it may directly affect the function of the gene, such as changing the amino acid sequence and affecting gene transcription or splicing. If it is in the intergenic region, it may play a role by regulating the expression of nearby genes.
Functional annotation database: With the help of databases such as Ensembl and UCSC Genome Browser, we can know the genomic characteristics of the region where SNP is located, including whether it is in the promoter and enhancer region, whether it overlaps with known regulatory elements, etc., which is helpful to infer the potential biological functions of SNP.
Linkage Disequilibrium and Haplotype
Linkage disequilibrium (LD): The significant SNP found in GWAS may only be in LD state with the real pathogenic site. By analyzing the structure of LD, other SNPs closely linked with significant SNPs can be determined, and the potential pathogenic area can be narrowed down. For example, if several SNPs are in an LD block, and one SNP is significant, then other SNPs in the block may also be related to the disease.
Haplotype analysis: Haplotype refers to multiple SNP combinations closely linked on the same chromosome. Some haplotypes may be more closely related to the risk of disease. Haplotype analysis can help us understand the relationship between genetic variation and disease more comprehensively, and sometimes we can find the missing related signals in single SNP analysis.
Biological Pathway and Functional Enrichment
Gene set enrichment analysis (GSEA): Mapping the disease-related genes in GWAS to known biological pathways or functional annotation gene sets, such as KEGG pathway and GO functional annotation, to determine which biological processes or pathways play an important role in the occurrence of diseases. For example, if it is found that immune-related pathways are significantly enriched in the GWAS results of a disease, it suggests that immune-related genes may play an important role in the pathogenesis of the disease.
Network analysis: Constructing gene-gene interaction network or protein-protein interaction network can further understand the relationship between disease-related genes, discover key regulatory nodes and molecular modules, and help to reveal the complex genetic regulatory mechanism of diseases.
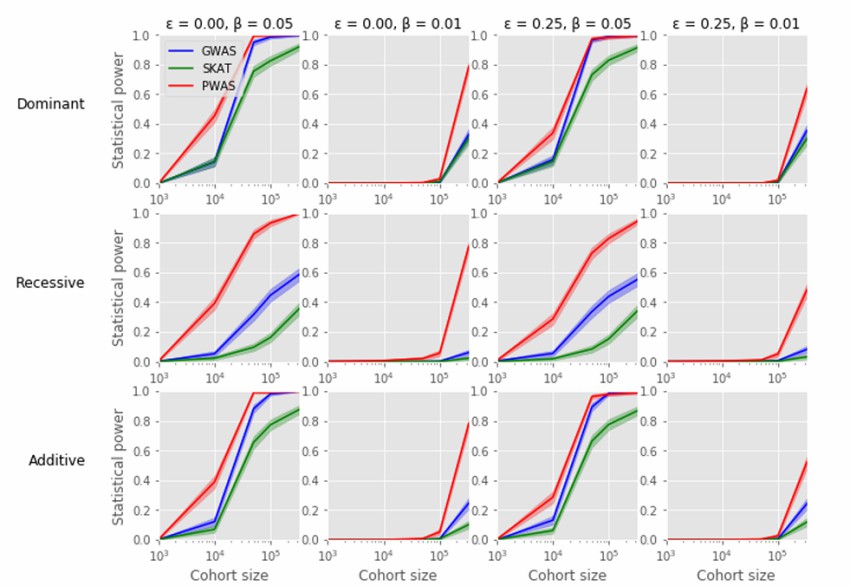 PWAS enriches GWAS discoveries across phenotypes (Brandes et al., 2019)
GWAS Data Interpretation in Agriculture
GWAS, or genome-wide association study, has made great achievements in agriculture. Through it, it can accurately locate the genes related to crop yield, quality and pest resistance.
Improvement of salt tolerance in rice: By integrating rice super-pan-genome, eQTL analysis and GWAS analysis, the key transcription factor gene STG5 was identified. It was found that 12898 genes were differentially expressed in rice leaves under salt stress, among which STG5 was specifically activated through dynamic eQTL regulatory network, and its promoter haplotype (Hap1) significantly enhanced salt tolerance. Functional verification showed that STG5 encoded AP2/ERF transcription factor and directly combined with ion transport gene OsHKT1. 5 and OsHKT2; 1, maintains ion homeostasis by regulating Na efflux and inhibiting Na influx, knocks out STG5, which leads to a significant increase in plant salt sensitivity, and provides a new target and molecular marker for salt-tolerant molecular breeding.
Study on drought resistance of wheat: Researchers genotyped 125 wheat varieties from 15 countries with 90k SNP Illumina iSelect chip, and revealed the genetic determinants of key characters related to drought resistance of wheat through GWAS analysis, including plant height, root length, dry weight of roots and stems, etc. In this study, stress sensitivity index (SSI) and stress tolerance index (STI) were calculated to evaluate the drought resistance of various varieties, and 53 SNP markers significantly related to drought resistance were successfully identified, and 44 unique candidate genes were identified on 17 chromosomes of wheat, which provided valuable information for improving drought resistance of wheat through molecular breeding and biotechnology in the future.
Study on cold tolerance and related characters of maize: A basic helix-loop-helix (bHLH) transcription factor encoding negative regulation of cold tolerance was found on chromosome 3 of maize by genome-wide association study analysis of 205 maize inbred lines. The nine SNP mutation sites in the promoter region divide the inbred lines into HapA and HapB haplotypes, and the gene expression level of HapB is low, showing stronger cold tolerance. Overexpression of this gene will lead to the decrease of cold tolerance of maize, and knockout will significantly enhance the cold tolerance of maize at seedling stage.
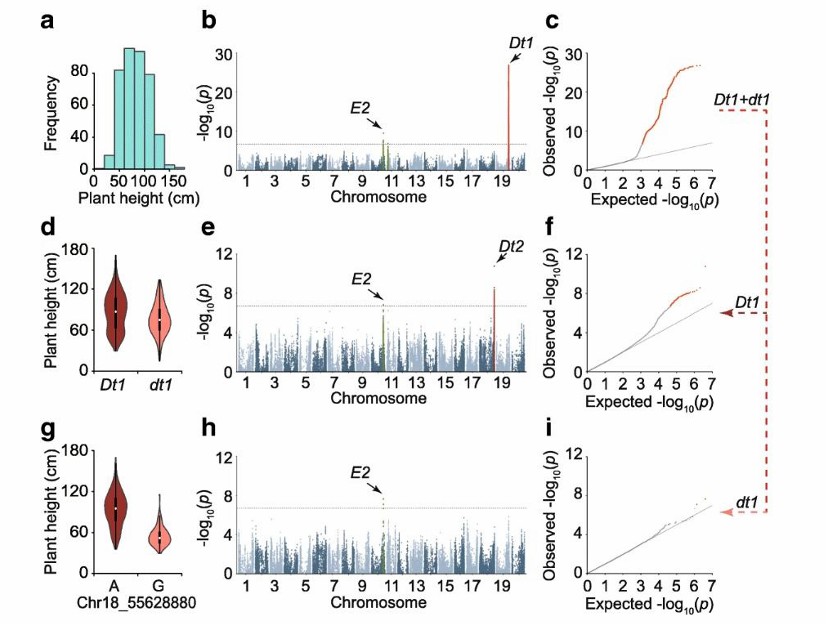 GWAS of the soybean plant height (Ding et al., 2024)
Limitation of GWAS Data Interpretation
GWAS is a method of association analysis of complex traits at the whole genome level, which is widely used in agriculture, but it also faces some challenges and limitations in the interpretation of the results, as follows.
Challenges Brought by Data Complexity
Huge amount of data: GWAS will generate a huge amount of genetic data, including a large number of SNP site information. When analyzing plants with GWAS, hundreds of thousands or even millions of SNP loci may be involved. Such a huge amount of data makes it extremely difficult to store, manage and analyze the data, and at the same time increases the complexity of interpreting the results.
Difficult to integrate multi-omics data: Modern agricultural research often involves multi-omics data, such as transcriptomics, protein omics and metabonomics. It is a complex process to integrate GWAS results with these multi-group data, and it is necessary to develop effective bioinformatics tools and analysis methods. At present, although there have been some attempts, there is still a lack of mature and universal integration strategies, which limits the comprehensive interpretation of GWAS results.
Complexity of Genetic Model
Gene interaction: Agronomic traits of crops are usually determined by the interaction of multiple genes, while GWAS is generally based on the correlation analysis of single SNP locus and traits, so it is difficult to directly capture the complex interaction between genes. For example, in maize, plant height traits may be jointly regulated by multiple genes, and there are complex interactions between these genes, such as epistatic effects. It is difficult to fully analyze the mechanism of these genes only by GWAS.
Environmental factors: Agricultural traits are often strongly influenced by environmental factors, and there is a gene-environment interaction effect. GWAS results may be disturbed by different environmental conditions, resulting in inconsistent association results in different environments. For example, wheat yield traits may show different genetic effects in different planting locations and climatic conditions, which challenges the stability and repeatability of GWAS results and increases the complexity of considering environmental factors when interpreting the results.
Limitations of Result Verification and Transformation
Verifying is difficult: Many related sites identified by GWAS need to be further verified for their functions and biological significance. However, due to the complexity and functional redundancy of plant genomes, it often takes a lot of time and resources to verify the functions of these loci. For example, in the study of Arabidopsis thaliana, although some SNP loci related to flowering time were found through GWAS, it needs a lot of experimental operations and phenotypic observation to verify the functions of these loci through gene editing and other technologies.
Slow transformation of breeding application: there is a certain lag in applying GWAS results to actual breeding work. On the one hand, it takes some time from the results of GWAS to the development of practical molecular markers for assisted selection; On the other hand, the breeding process itself is a long-term process, which requires generations of hybridization, screening and identification. Therefore, even if the genes related to excellent traits are found through GWAS, it is difficult to transform them into actual breeding results in a short time, which limits the rapid application of GWAS in agricultural production.
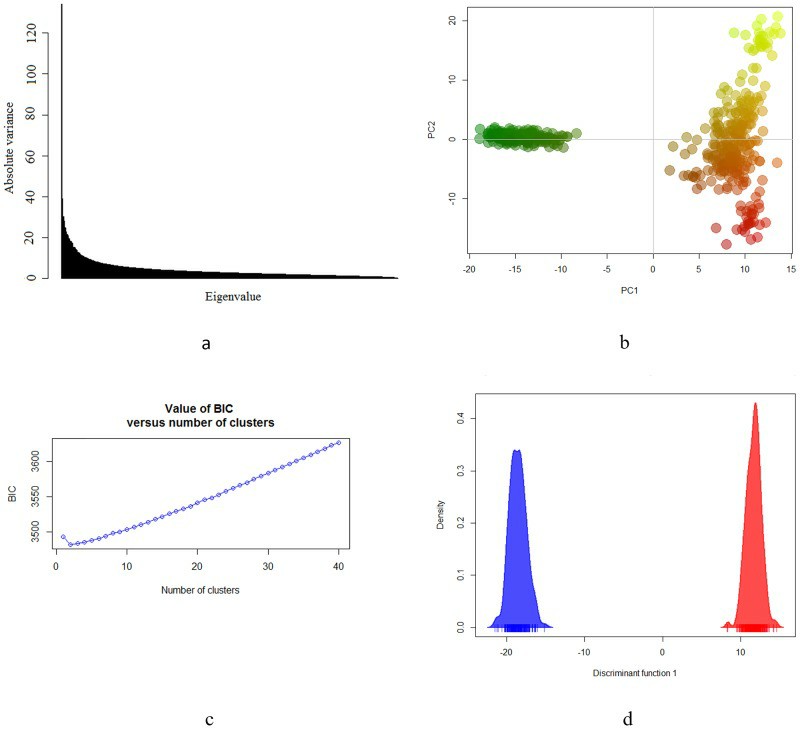
Genetic structure of the Brazilian Gir population (Maiorano et al., 2018)
Future prospects of GWAS Data Interpretation
The interpretation of GWAS data contains a very broad future prospect in the agricultural field. It can accurately locate the genes closely related to the excellent traits and stress resistance of crops, help cultivate better varieties with high quality, high yield and resistance to pests and diseases, optimize livestock breeding, and push agriculture towards a new journey of efficient and sustainable development in all directions.
Multiomics Fusion
Combining with transcriptomics: By combining GWAS with transcriptomics data, we can understand the expression of genes in different tissues, developmental stages and environmental conditions, further reveal the gene regulatory network and molecular mechanism, and explain how genotypes are transformed into phenotypes.
Combining with protein Metabonomics and Metabonomics: By integrating the information of protein Metabonomics and Metabonomics, we can fully understand the molecular changes in organisms, clarify the influence of gene variation on protein expression and metabolite accumulation, and provide more direct targets and theoretical basis for genetic improvement of Crops and Livestock.
Combining with Microbiology: MGWAS combined with genome and microbiome can identify microbial species and genes that affect plant growth and development, disease resistance and yield, provide new perspectives and strategies for breeding and crop management, and reveal the complex interaction mechanism between microorganisms and plant hosts, thus promoting the development of eco-agriculture.
Application Expansion in Crop Breeding
Analysis of Complex Traits: For complex traits such as crop yield, quality and stress resistance, GWAS will deeply analyze its genetic basis, dig out more key genes and genetic markers, provide rich targets for crop genetic improvement, and cultivate crop varieties with high yield, high quality and strong stress resistance.
Accelerate the breeding process: With the help of molecular markers identified by GWAS, breeding materials can be accurately selected at an early stage, which can improve the selection efficiency, shorten the breeding cycle and accelerate the cultivation, popularization and application of excellent varieties.
Coping with climate change: Studying the genetic mechanism of crops' adaptability to environmental change through GWAS can help to select varieties that adapt to climate change, such as drought-tolerant, salt-tolerant and high-temperature-resistant crops, and ensure global food security.