
Hydrogen Price Index 2026: Q2 Trends, Data & Price Forecast
Hydrogen Price Index data for Q2 2026 shows a wide regional pricing spread, with reported values ranging from USD 1,145/MT in the USA to USD 3,049/MT in the Netherlands.
 Stephenthomas
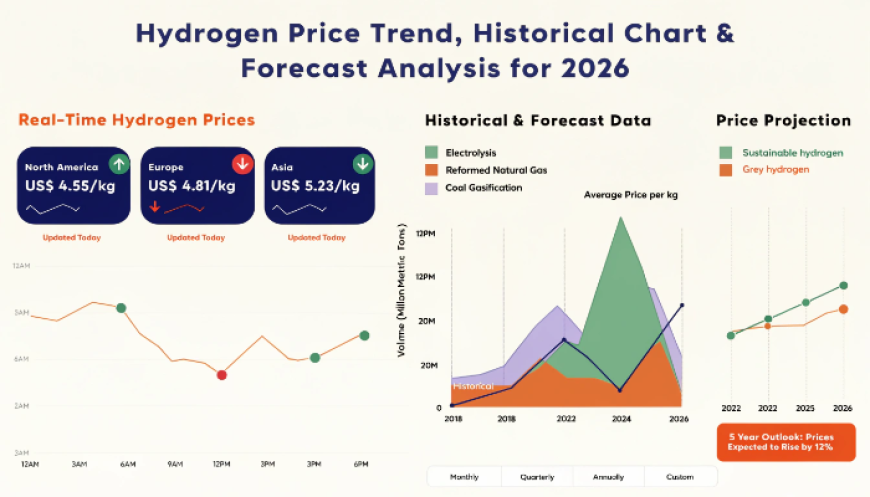
Global Hydrogen Price Trends & Updates – Q2 2026
Hydrogen Price Index data for Q2 2026 shows a wide regional pricing spread, with reported values ranging from USD 1,145/MT in the USA to USD 3,049/MT in the Netherlands. The available dataset indicates substantial differences in production economics, energy costs, logistics, and end-use demand across major consuming regions. However, the supplied July 2026 dataset does not provide a month-on-month or quarter-on-quarter percentage change, so a precise overall percentage increase or decrease cannot be stated without introducing unverified data. For procurement teams, the regional dispersion remains the key pricing signal. The Hydrogen Price Forecast therefore requires close monitoring of energy costs, electrolyzer economics, industrial demand, freight conditions, and regional supply availability.
Hydrogen Price Outlook Q2 2026: Regional Price Snapshot
- USA: USD 1,145/MT
- Japan: USD 2,233/MT
- Netherlands: USD 3,049/MT
- UAE: USD 2,603/MT
- Saudi Arabia: USD 2,401/MT
The spread shows pronounced regional cost gaps, with the Netherlands recording the highest reported value and the USA the lowest. Japan and Middle Eastern suppliers occupy an intermediate range, reflecting differences in energy economics, production structures, transportation requirements, and industrial demand. The dispersion is important for buyers assessing sourcing alternatives and delivered-cost exposure.
Hydrogen Price Chart: What Regional Prices Reveal
The regional pricing structure suggests that hydrogen procurement economics remain highly location dependent. The USA's USD 1,145/MT level is substantially below Japan, the UAE, Saudi Arabia, and the Netherlands, while the Netherlands represents the highest reported price in the supplied dataset. Such differences can influence import decisions, long-term contracting, and the relative attractiveness of domestic versus transported hydrogen.
Regional Hydrogen Prices Analysis Q2 2026 - Breakdown
North America Hydrogen Prices: USA
The USA recorded USD 1,145/MT, the lowest price among the five reported locations. The available data supports a comparatively lower pricing position, although the supplied figures do not establish a monthly direction. Production economics, established industrial infrastructure, and domestic energy availability can influence supply competitiveness.
Asia-Pacific Hydrogen Prices: Japan
Japan recorded USD 2,233/MT. Its price is considerably above the USA level, reflecting the economics of hydrogen supply for an import-oriented industrial system. Demand from mobility, refining, power generation, and industrial applications can affect procurement requirements.
India and China: No verified July 2026 prices were supplied for India or China. Consequently, no price, trend direction, or demand-supply conclusion is assigned to these countries rather than introducing unsupported figures.
South America Hydrogen Prices: Brazil
No verified July 2026 price was supplied for Brazil. A country-specific price or trend assessment would require an additional verified data point.
Supply And Demand Overview – July 2026
Hydrogen supply conditions remain closely connected to production technology and energy inputs. Grey and blue hydrogen economics are influenced by natural gas and carbon-management costs, while green hydrogen depends heavily on electricity prices, electrolyzer utilization, renewable power availability, and project scale.
On the demand side, refining, ammonia production, methanol, steelmaking, mobility, and emerging low-carbon industrial applications remain important consumption channels. Procurement teams should therefore evaluate both physical availability and delivered economics rather than relying on a single regional benchmark.
Hydrogen Price Index & Historical Analysis: Q2 2026
The supplied dataset provides Q2 2026 regional prices but does not include a complete monthly index series for April, May, and June or a July month-on-month index value. Therefore, a precise monthly index movement cannot be quantified from the verified figures alone.
IMARC Group's July 2026 price-tracking database and methodology can be used to monitor regional price movements, historical benchmarks, and procurement-relevant developments. For analysts, the key historical comparison should focus on changes in energy inputs, production costs, freight, industrial utilization, and supply additions between quarters.
Hydrogen Price Forecast 2026: Next 12 Months
Over the next 12 months, hydrogen pricing is likely to remain differentiated by production route and geography. Lower-cost renewable electricity and larger-scale electrolyzer deployment could improve green hydrogen economics, while natural gas and carbon-related costs will remain important for conventional and blue hydrogen.
For buyers, the most useful forecasting approach is scenario-based: monitor energy prices, announced capacity, project commissioning schedules, infrastructure availability, trade flows, and industrial offtake. Regional price gaps may remain significant where transportation and conversion costs limit arbitrage.
Key Factors Affecting Hydrogen Prices: Monthly Perspective
- Energy costs: Electricity and natural gas prices directly influence production economics.
- Industrial demand: Refining, ammonia, methanol, steel, and mobility applications affect offtake requirements.
- Freight: Hydrogen transportation and handling can materially affect delivered procurement costs.
- Production capacity: New electrolyzer, blue hydrogen, and conventional capacity can alter regional supply balances.
- Chlor-alkali demand: Hydrogen generated as a by-product of chlor-alkali operations can influence localized availability and pricing.
- Infrastructure: Storage, pipelines, terminals, and distribution networks affect regional accessibility.
- Policy support: Clean-hydrogen incentives and carbon regulations can influence project economics and purchasing decisions.
What Is Hydrogen?
Hydrogen is a light, energy-dense gas used as an industrial feedstock and energy carrier. It is widely consumed in refining and chemical production and is increasingly considered for low-carbon steelmaking, transportation, power, and energy storage. Production routes include grey hydrogen from fossil fuels, blue hydrogen with carbon capture, and green hydrogen produced through water electrolysis using electricity.
Recent Hydrogen Developments: July 2026 Highlights
July procurement conditions should be assessed against changes in production capacity, project commissioning, cross-border trade, infrastructure development, and supplier strategies. New electrolyzer capacity can improve prospective green-hydrogen supply, while changes in conventional production economics can affect competing supply routes.
For procurement managers, supplier announcements should be evaluated against actual operational capacity rather than announced capacity alone. Trade shifts, infrastructure constraints, and long-term offtake agreements can also determine how quickly additional production reaches the spot or contract market.
FAQs About Hydrogen Prices Insights & Market Analysis:
What Is the Hydrogen Price Index In 2026?
The supplied Q2 2026 dataset reports hydrogen prices from USD 1,145/MT in the USA to USD 3,049/MT in the Netherlands. It demonstrates substantial regional price differentiation, although a complete monthly index series was not supplied.
What Does the Hydrogen Price Chart Show?
The Hydrogen Price Chart shows a wide regional spread, with the USA at USD 1,145/MT, Japan at USD 2,233/MT, Saudi Arabia at USD 2,401/MT, the UAE at USD 2,603/MT, and the Netherlands at USD 3,049/MT.
What Is the Hydrogen Price Forecast 2026?
The Hydrogen Price Forecast 2026 points to continued regional differentiation as energy costs, new production capacity, infrastructure, industrial demand, and freight influence procurement economics. Exact future prices require updated monthly and regional datasets.
How IMARC Group Helps with Hydrogen Price Intelligence
IMARC Group provides structured pricing intelligence covering regional benchmarks, historical movements, supply-demand conditions, and forward-looking price assessment. Its July 2026 price-tracking methodology supports procurement teams in comparing regional hydrogen economics and identifying cost drivers. The reported Q2 2026 data highlights a substantial geographic price spread. Over the next 12 months, energy economics, new capacity, infrastructure, and industrial offtake will remain critical variables for hydrogen purchasing strategies.
Explore related pricing market reports for broader market insights: https://www.imarcgroup.com/pricing-market-reports
Contact Us:
IMARC Group
134 N 4th St., Brooklyn, NY 11249, USA
Email: sales[@]imarcgroup.com
Tel No:(D) +91 120 433 0800
United States: +1-201971-6302